What is Net Promoter Score (NPS)
Net Promoter Score (NPS) is a system that’s meant to go beyond testing the satisfaction levels of the customer with the company. It is a measurement index that ranges from 0-10, that is used to measure the level of customer satisfaction and loyalty. It retrieves data that can help organizations conclude how satisfied someone is with their brand and whether they would spread a word about it. If the growth of a company is reliant mainly through word-of-mouth, Net Promoter Score calculation has to be put in place to know whether the customers will recommend your product to their friends and colleagues.
When was the last time you liked a brand so much you recommended it to your friend and wanted them to try it out?
If you have ever done so, you understand the basic principle of Net Promoter Score (NPS), that it is used for measuring customer satisfaction. NPS not only helps you measure customer satisfaction but also customer loyalty. It tests if someone likes your brand, organization, products or services that they recommend it to their family, friends, and colleagues.
Irrespective of how big or small a business is or which sector the business is in, customer satisfaction and loyalty are always important. Acknowledgment from a customer is what everyone’s looking for, isn’t it?
With the world transforming digitally day by day, it has become extremely convenient to get in touch with more prospective and existing customers. Online surveys are often implemented to know what customers think about a product and because of this, survey methods like Net Promoter Score calculation (NPS) are being implemented.
How does the Net Promoter Score (NPS) Calculation Formula work?
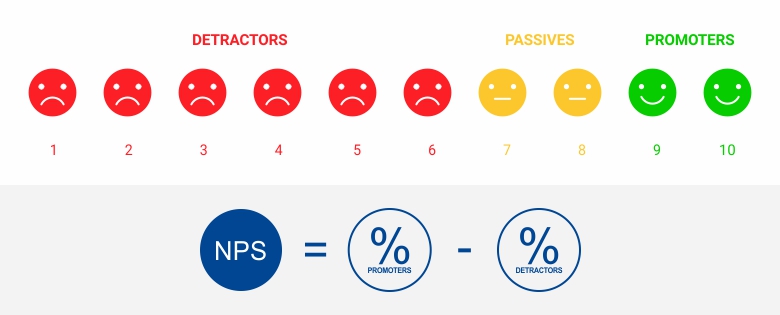
To start with your the customers or consumers are asked to rate their chances to recommend an organization or a business to their family, friends or colleagues on a 0-10 point scale. The customer has to choose one number between 0-10 (where 0 is the lowest and 10 being the highest)
Based on the number chosen on the scale the customer is then classified as Detractors, Passives, and Promoters.
0-6 are Detractors (least likely to recommend your brand, in fact, might spread a negative word of mouth)
7-8 are Passives (May or may not recommend your brand, may even sway away to your competitors)
9-10 are Promoters (Loyal! They will absolutely recommend your brand)
Net Promoter Score (NPS) Calculation Example of Implementation
Nation wise NPS calculation example:
Let take an example – Company X wants to know about their customer experience and customer loyalty among North and South American customers. They conduct Net Promoter Score surveys to a group of survey respondents in these regions.
In total, they receive 5000 responses from customers in North America and 1000 responses from customers in South America.
Let’s break down these responses.
Net Promoter Score Formula:(Number of Promoters — Number of Detractors) / (Number of Respondents) x 100
You have received a total of 5000 responses (North America)
- 100 responses were in the 0–6 range (Detractors)
- 500 responses were in the 7–8 range (Passives)
- 4400 responses were in the 9–10 range (Promoters)
Using the NPS formula: 4400-100/5000 *100= 86
Net Promoter Score is always shown as a whole number and never as a percentage. Hence your NPS is 86.
You have received a total of 1000 responses (South America)
- 400 responses were in the 0–6 range (Detractors)
- 100 responses were in the 7–8 range (Passives)
- 500 responses were in the 9–10 range (Promoters)
Using the NPS formula: 500-400/1000 *100= 10
Net Promoter Score is always shown as a whole number and never as a percentage. Hence your NPS is 10.
From the calculation above it is evident that the organization needs to improve their customer service in South America as their NPS score is 10.
Regionwise NPS Calculation Example:
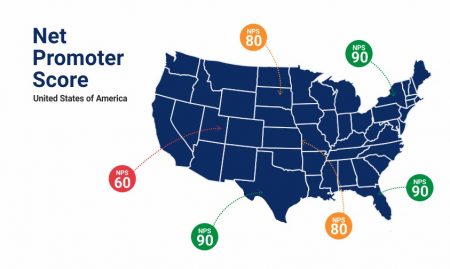
The same organization conducts Net Promoter Score surveys to a group of survey respondents in the six regions in North America where they have their stores.
They receive the responses and calculate their Net Promoter Score (NPS) using Net Promoter Score (NPS) formula. Following were the scores:
NPS for Region 1: 80
NPS for Region 2: 90
NPS for Region 3: 90
NPS for Region 4: 80
NPS for Region 5: 90
NPS for Region 6: 60
Clearly, from the NPS score region, 6 needs improvement in the customer service to get a higher NPS score.
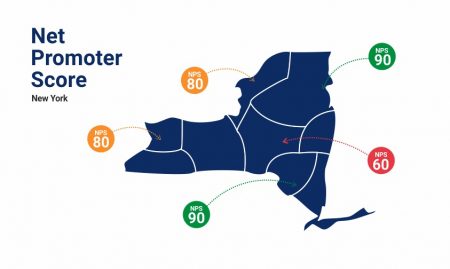
Citywise NPS Calculation Example:
Let’s assume that the same organization has 6 stores in the same city and they want to know the NPS score for all the stores and they send out a survey to a group of respondents and following are the results obtained applying the NPS formula:
NPS for Store 1: 80
NPS for Store 2: 90
NPS for Store 3: 60
NPS for Store 4: 90
NPS for Store 5: 80
Since the NPS score for store 3 is 60, therefore, they will need to improve their customer experience and customer satisfaction to improve their NPS score.
Net Promoter Score (NPS) calculation can be implemented at various levels as shown in the above examples.
If you are interested in doing this calculation, we have created a free NPS calculator, however the ideal is to use a tool that allows you to automatically collect and analyze your data, QuestionPro CX can help you with that.
Net Promoter Score calculation with QuestionPro
One of the key attributes of NPS calculation is to check how varying is it over a period of time. This requires graphical representation of the statistical data. The insights can be collected using NPS survey, with time as a variable.
The QuestionPro NPS Survey Dashboard is the most advanced analytics platform for NPS measurement. It provides real-time and detailed NPS Value charts and graphs as they vary over time.
Manual Net Promote Score calculation is an option that might work with a mere 100 responses but automation will be required when there are around 5000 responses or more. Customer Experience (CX) by QuestionPro is a platform that has been developed scientifically to collect and analyze unlimited responses.
Using QuestionPro CX, you can compose, send and analyze NPS surveys in a jiffy. All you need to do is log in to your QuestionPro CX account and select one of the 40 already existing NPS survey questions and customize the survey by adding your company logo and other details.
Add your respondent Email IDs by either entering manually or importing them. Click on send or schedule the survey for a more suitable time. The QuestionPro CX dashboard will be refreshed as and when respondents take the survey.
Charts and reports are created to help you analyze the NPS results. Also, an NPS meter is provided on the dashboard that’ll show results on a -100 to +100 scale about what your customers think about your product in real-time.
With features like Promoter Amplification that forwards a link that allows promoters to share their response to social media and Detractor Recovery that offers the organization a provision to receive negative responses and automate customizable actions, QuestionPro CX makes sure your organization constantly strives to be the best in the business.
 Survey Software
Easy to use and accessible for everyone. Design, send and analyze online surveys.
Survey Software
Easy to use and accessible for everyone. Design, send and analyze online surveys.
 Research Suite
A suite of enterprise-grade research tools for market research professionals.
Research Suite
A suite of enterprise-grade research tools for market research professionals.
 CX
Experiences change the world. Deliver the best with our CX management software.
CX
Experiences change the world. Deliver the best with our CX management software.
 Workforce
Create the best employee experience and act on real-time data from end to end.
Workforce
Create the best employee experience and act on real-time data from end to end.